Analysis of April 2014 TC election
Some people asked me to analyze the results of the recent TC election in the same way I ran the analysis for the previous one. I finally found the time to do it, here are the results.
The April 2014 election was set up to renew 7 of the 13 TC members. We had 17 candidates, you can find the official results of the election here.
Condorcet spread
This graph shows how each candidate was ranked. The first bubble on the left represents the number of people that have placed that candidate as their only first choice. The last bubble on the right represents the number of people that have placed this candidate as their only last choice. If multiple candidates are ranked at the same level, we average their "score".
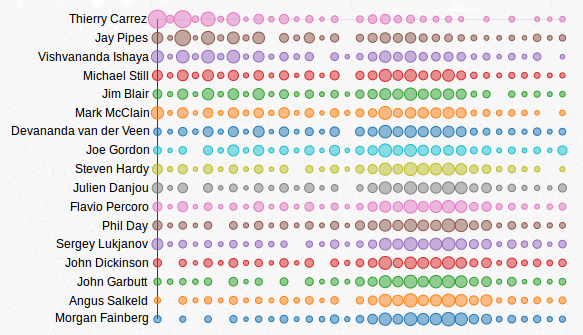
We can see that once again the Condorcet algorithm preferred a consensual candidate (Devananda) over less-consensual ones (Julien, Sergey). It's also interesting to compare the spread between Michael, Jim and Mark.
Proportional Condorcet
At the previous election, running the same ballot with CIVS so-called "proportional mode" option altered the result. This time, the proportional mode returns the exact same set of winners.
Partisan voting
The goal of this analysis is to detect blocks of voters, who consistently place a set of candidates above anyone else. I slightly modified my script to reveal the most popular pairs: calculate how many people place the same two people above anyone else, and try to detect bias in the most popular pairs.
The most popular pair was Vish/Thierry (with 5.58% of voters placing us above anyone else). We could call that the old-timers party. The second most popular pair was Jay/Sergey (the Mirantis party) with 5.13%. 4.24% of the voters placed the Julien/Thierry pair on top of anything else: that could reveal an influential French party ! The Foundation party pair (Jim/Thierry) was preferred by 3.34%, same result as the Foodie party (Mark/Thierry). The Jay/Vish pair was preferred by 3.12% of the voters (a variant of the old-timers party). It's also worth noting that 2.45% of the voters favored the Flavio/Steven pair (best score of the RedHat pairs), 1.56% favored Michael/JohnG (best score of the Rackspace pairs) and 1.11% favored Joe/Devananda (best score of the HP pairs).
While this analysis shows some corporate bias in the vote, it's worth noting that (a) it's extremely limited, (b) it's actually decreasing from the previous election, (c) it did not affect the result in any significant way and (d) it's comparable to other bias (old timers, French people).
Run your own analysis
That's all I had to share. But don't blindly trust me, you can run your own analysis by downloading the anonymized ballot !