An analysis of the Technical Committee election
When we changed the Technical Committee membership model to an all-directly-elected model a few months ago, we proposed we would enable detailed ballot reporting in order to be able to test alternative algorithms and run various analysis over the data set. As an official for this election, here is my analysis of the results, hoping it will help in the current discussion on a potential evolution of the Foundation individual members voting system.
Condorcet method
In the OpenStack technical elections, we always used the Condorcet method (with the Schulze completion method), as implemented by Cornell's CIVS public voting system. In a Condorcet vote, you rank your choices in order of preference (it's OK to rank multiple choices at the same level). To calculate the results, you simulate 1:1 contests between all candidates in the set. If someone wins all such contests, he is the Condorcet winner for the set. The completion method is used to determine the winner when there is no clear Condorcet winner. Most completion methods can result in ties, which then need to be broken in a fair way.
Condorcet spread
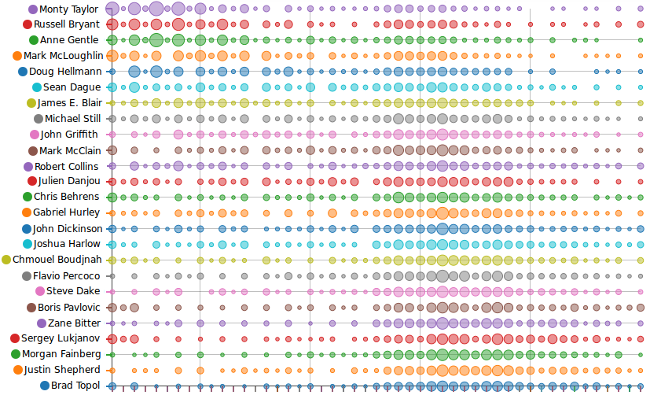
One thing we can analyze is the spread of the rankings for any given candidate:

On that graph the bubbles on the left represent the number of high rankings for a given candidate (bubbles on the right represent low rankings). When multiple candidates are given the same rank, we average their ranking (that explains all those large bubbles in the middle of the spectrum). A loved-or-hated candidate would have large bubbles at each end of the spectrum, while a consensus candidate would not.
Looking at the graph we can see how Condorcet favors consensus candidates (Doug Hellmann, James E. Blair, John Griffith) over less-consensual ones (Chris Behrens, Sergey Lukjanov, Boris Pavlovic).
Proportional Condorcet ?
Condorcet indeed favors consensus candidates (and "natural" 1:1 election winners). It is not designed to represent factions in a proportional way, like STV is. There is an experimental proportional representation option in CIVS software though, and after some ballot conversion we can run the same ballots and see what it would give.
I set up a test election and the results are here. The winning 11 would have included Sergey Lukjanov instead of John Griffith, giving representation to a less-consensual candidate. That happens even if a clear majority of voters prefers John to Sergey (John defeats Sergey in the 1:1 Condorcet comparison by 154-76).
It's not better or worse, it's just different... We'll probably have a discussion at the Technical Committee to see whether we should enable this experimental variant, or if we prefer to test it over a few more elections.
Partisan voting ?
Another analysis we can run is to determine if there was any corporate-driven voting. We can look at the ballots and see how many of the ballots consistently placed all the candidates from a given company above any other candidate.
7.8% of ballots placed the 2 Mirantis candidates above any other. 5.2% placed the 2 IBM candidates above any other. At the other end of the spectrum, 0.8% of ballots placed all 5 Red Hat candidates above any other, and 1.1% of the ballots placed all 4 Rackspace candidates above any other. We can conclude that partisan voting was limited, and that Condorcet's preference for consensus candidates further limited its impact.
What about STV ?
STV is another ranked-choice election method, which favors proportional representation. Like the "proportional representation" CIVS option described above, it may result in natural Condorcet winners to lose against more factional candidates.
I would have loved to run the same ballots through STV and compare the results. Unfortunately STV requires strict ranking of candidates in an order of preference. I tried converting the ballots and randomly breaking similar rankings, but the end results vary extremely depending on that randomness, so we can't really analyze the results in any useful way.
Run your own analysis !
That's it for me, but you can run your own analysis by playing with the CSV ballot file yourself ! Download it here, and share the results of your analysis if you find anything interesting !
.